Code GPU with CUDA
Identifying performance limiters
Created by Marina Kolpakova ( cuda.geek ) for Itseez
previous
Outline
- How to identify performance limiters?
- What and how to measure?
- Why to profile?
- Profiling case study: transpose
- Code paths analysis
Out of scope
- Visual profiler opportunities
How to identify performance limiters
-
Time
- Subsample when measuring performance
- Determine your code wall time. You'll optimize it
-
Profile
- Collect metrics and events
- Determine limiting factors (e.c. memory, divergence)
How to identify performance limiters
-
Prototype
- Prototype kernel parts separately and time them
- Determine memory access or data dependency patterns
-
(Micro)benchmark
- Determine hardware characteristics
- Tune for particular architecture, GPU class
- Look into SASS
- Check compiler optimizations
- Look for a further improvements
Timing: What to measure?
- Wall time: user will see this time
- GPU time: specific kernel time
- CPU ⇔ GPU memory transfers time:
- not considered for GPU time analysis
- significantly impact wall time
- Data dependent cases timing:
- worst case time
- time of single iteration
- consider probability
How to measure?
system timer (Unix)
#include <time.h>
double runKernel(const dim3 grid, const dim3 block)
{
    struct timespec startTime, endTime;
    clock_gettime(CLOCK_MONOTONIC, &startTime);
    kernel<<<grid, block>>>();
    cudaDeviceSynchronize();
    clock_gettime(CLOCK_MONOTONIC, &endTime);
    int64 startNs = (int64)startTime.tv_sec * 1000000000 + startTime.tv_nsec;
    int64 endNs   = (int64)endTime.tv_sec   * 1000000000 + endTime.tv_nsec;

    return (endNs - startNs) / 10000000.; // get ms
}
Preferred for wall time measurement
How to measure?
Timing with CUDA events
double runKernel(const dim3 grid, const dim3 block)
{
    cudaEvent_t> start, stop;
    cudaEventCreate(&start); cudaEventCreate(&stop);
    cudaEventRecord(start, 0);
    kernel<<<grid, block>>>();
    cudaEventRecord(stop, 0);
    cudaEventSynchronize(stop);
    float ms;
    cudaEventElapsedTime(&ms, start, stop);
    cudaEventDestroy(start); cudaEventDestroy(stop);
    return ms;
}
- Preferred for GPU time measurement
- Can be used with CUDA streams without synchronization
Why to profile?
Profiler will not do your work for you,
but profiler helps:
- to verify memory access patterns
- to identify bottlenecks
- to collect statistic in data-dependent workloads
- to check your hypothesis
- to understand how hardware behaves
Think about profiling and benchmarking
as about scientific experiments
Device code profiler
- events are hardware counters, usually reported per SM
- SM id selected by profiler with assumption that all SMs do approximately the same amount of work
- Exceptions: L2 and DRAM counters
- metrics computed from number of events and hardware specific properties (e.c. number of SM)
- Single run can collect only a few counters
- Profiler repeats kernel launches to collect all counters
- Results may vary for repeated runs
Profiling for memory
- Memory metrics
- which have load or store in name counts from software perspective (in terms of memory requests)
local_store_transactions
- which have read or write in name counts from hardware perspective (in terms of bytes transfered)
l2_subp0_read_sector_misses
- which have load or store in name counts from software perspective (in terms of memory requests)
- Counters are incremented
- per warp
- per cache line/transaction size
- per request/instruction
Profiling for memory
- Access pattern efficiency
- check the ratio between bytes requested by the threads / application code and bytes moved by the hardware (L2/DRAM)
- use
g{ld,st}_transactions_per_requestmetric
- Throughput analysis
- compare application HW throughput to possible for your GPU (can be found in documentation)
g{ld,st}_requested_throughput
instructions/bytes ratio
- Profiler counters:
instructions_issued, instructions_executed- incremented by warp, but “issued” includes replays
global_store_transaction, uncached_global_load_transaction- transaction can be 32,64,128 byte. Requires additional analysis to determine average.
- Compute ratio:
- (warpSize X instructions_issued) v.s. (global_store_transaction + l1_global_load_miss) * avgTransactionSize
List of events for sm_35
| domain | event |
|---|---|
| texture (a) | tex{0,1,2,3}_cache_sector_{queries,misses} |
| rocache_subp{0,1,2,3}_gld_warp_count_{32,64,128}b | |
| rocache_subp{0,1,2,3}_gld_thread_count_{32,64,128}b | |
| L2 (b) | fb_subp{0,1}_{read,write}_sectors |
| l2_subp{0,1,2,3}_total_{read,write}_sector_queries | |
| l2_subp{0,1,2,3}_{read,write}_{l1,system}_sector_queries | |
| l2_subp{0,1,2,3}_{read,write}_sector_misses | |
| l2_subp{0,1,2,3}_read_tex_sector_queries | |
| l2_subp{0,1,2,3}_read_{l1,tex}_hit_sectors | |
| LD/ST (c) | g{ld,st}_inst_{8,16,32,64,128}bit |
| rocache_gld_inst_{8,16,32,64,128}bit |
List of events for sm_35
| domain | event |
|---|---|
| sm (d) | prof_trigger_0{0-7} |
| {shared,local}_{load,store} | |
| g{ld,st}_request | |
| {local,l1_shared,__l1_global}_{load,store}_transactions | |
| l1_local_{load,store}_{hit,miss} | |
| l1_global_load_{hit,miss} | |
| uncached_global_load_transaction | |
| global_store_transaction | |
| shared_{load,store}_replay | |
| global_{ld,st}_mem_divergence_replays |
List of events for sm_35
| domain | event |
|---|---|
| sm (d) | {threads,warps,sm_cta}_launched |
| inst_issued{1,2} | |
| [thread_,not_predicated_off_thread_]inst_executed | |
| {atom,gred}_count | |
| active_{cycles,warps} |
List of metrics for sm_35
| metric |
|---|
| g{ld,st}_requested_throughput |
| tex_cache_{hit_rate,throughput} |
| dram_{read,write}_throughput |
| nc_gld_requested_throughput |
| {local,shared}_{load,store}_throughput |
| {l2,system}_{read,write}_throughput |
| g{st,ld}_{throughput,efficiency} |
| l2_{l1,texture}_read_{hit_rate,throughput} |
| l1_cache_{global,local}_hit_rate |
List of metrics for sm_35
| metric |
|---|
| {local,shared}_{load,store}_transactions[_per_request] |
| gl{d,st}_transactions[_per_request] |
| {sysmem,dram,l2}_{read,write}_transactions |
| tex_cache_transactions |
| {inst,shared,global,global_cache,local}_replay_overhead |
| local_memory_overhead |
| shared_efficiency |
| achieved_occupancy |
| sm_efficiency[_instance] |
| ipc[_instance] |
| issued_ipc |
| inst_per_warp |
List of metrics for sm_35
| metric |
|---|
| flops_{sp,dp}[_add,mul,fma] |
| warp_execution_efficiency |
| warp_nonpred_execution_efficiency |
| flops_sp_special |
| stall_{inst_fetch,exec_dependency,data_request,texture,sync,other} |
| {l1_shared,l2,tex,dram,system}_utilization |
| {cf,ldst}_{issued,executed} |
| {ldst,alu,cf,tex}_fu_utilization |
| issue_slot_utilization |
| inst_{issued,executed} |
| issue_slots |
ROI profiling
#include <cuda_profiler_api.h>

// algorithm setup code
udaProfilerStart();
perf_test_cuda_accelerated_code();
cudaProfilerStop();
- Profile only part that you are optimizing right now
- shorter and simpler profiler log
- Do not significantly overhead your code runtime
- Used with
--profile-from-start offnvprof option
Case study: Matrix transpose
& nvprof --devices 2 ./bin/demo_bench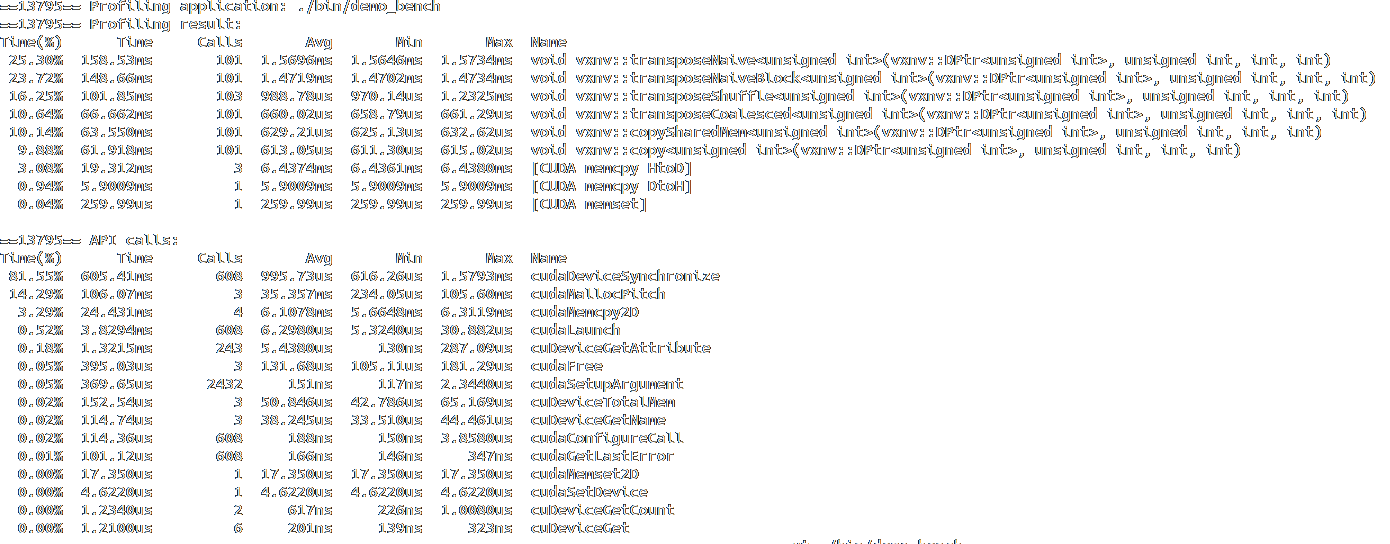
Case study: Matrix transpose
& nvprof --devices 2 \
--metrics gld_transactions_per_request,gst_transactions_per_request \
./bin/demo_bench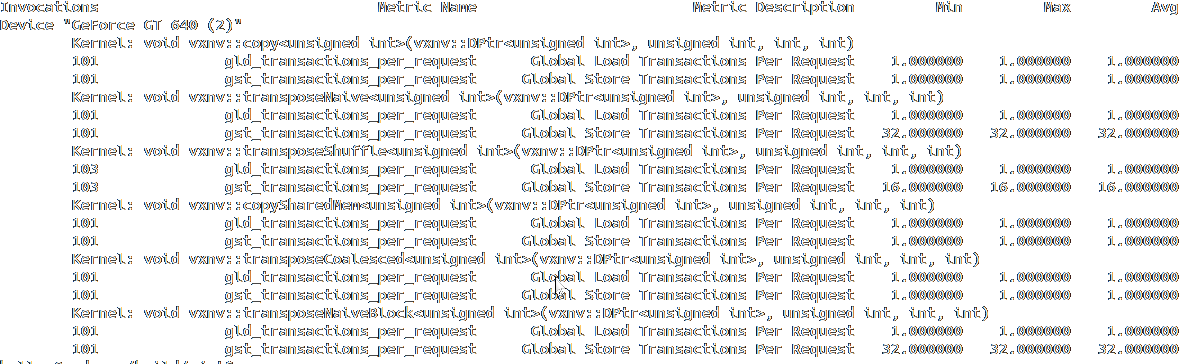
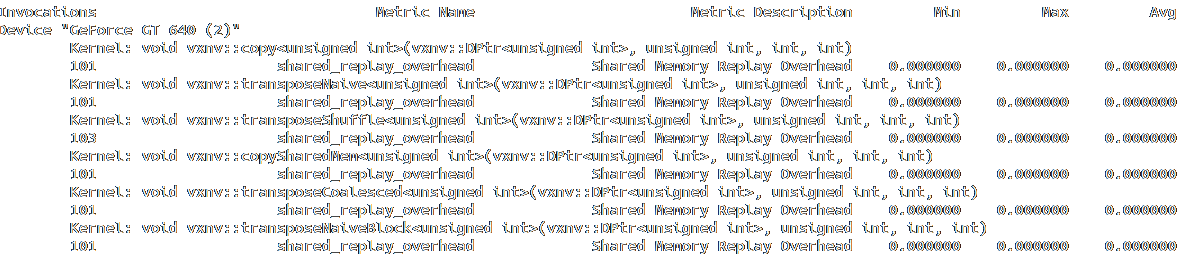
Case study: Matrix transpose
& nvprof --devices 2 --metrics shared_replay_overhead ./bin/demo_bench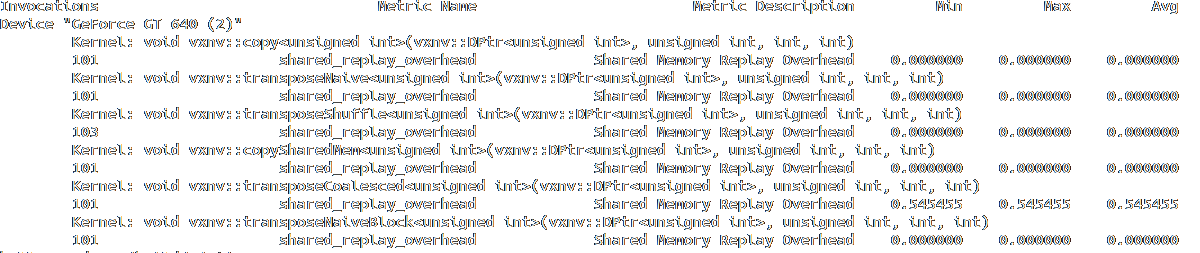
Code paths analysis
- The main idea: determine performance limiters through measuring different parts independently
- Simple case: time memory-only and math-only versions of the kernel
- Shows how well memory operations are overlapped with arithmetic: compare the sum of mem-only and math-only times to full-kernel time
template<typename T>
__global__ void
benchmark_contiguous_direct_load(T* s, typename T::value_type* r, bool doStore)
{
   int global_index = threadIdx.x + blockDim.x * blockIdx.x;
   T data = s[global_index];
   asm (""::: "memory");
   if (s && doStore)
       r[global_index] = sum(data);
}
device side timing
- Device timer located on ROP/SM depending on hardware revision
- It's relatively easy to compute per thread values but hard to analyze kernel performance due to grid serialization
- sometimes is suitable for benchmarking
template<typename T, typename D, typename L>__global__
void latency_kernel(T** a, int len, int stride, int inner_its,
    D* latency, L func)
{
    D start_time, end_time;
    volatile D sum_time = 0;
    for (int k = 0; k < inner_its; ++k)
    {
        T *j = ((T*) a) + threadIdx.y * len + threadIdx.x;
        start_time = clock64();
        for (int curr = 0; curr < len / stride; ++curr) j = func(j);
        end_time = clock64(); sum_time += (end_time - start_time);
    }
    if (!threadIdx.x) atomicAdd(latency, sum_time);
}
Final words
- Time
- Profile
- (Micro)benchmark
- Prototype
- Look into SASS